Racial Disparity Data Dashboards

Public Safety Impact
Fully Customizable Data Dashboards
Sentinel Strategies Group designs and maintains custom dashboards for our partners representing a potentially wide range of police activities - use of force, traffic stops, pedestrian stops - depending upon need, data availability, and areas the partner agency would like to monitor. We have deep experience analyzing agency data for disparity monitoring purposes and can tailor many different interactive visuals to help agencies monitor change over time.
The dashboard can be for internal use only or portions can be made publicly accessible, depending upon agency preference. Internal dashboards are password-protected for secure access and can reside on an agency's own website if desired.
Early Warning
Our Dashboards Supplement Other Early Warning Systems
Sentintel Strategies Group designs dashboards for monitoring officer interactions with community members. Our clear and intuitive visuals allow leaders to keep a finger on the pulse of their agencies, specialized units, or patrol divisions to help them identify and react to trends before they become the target of a complaint, lawsuit, or external investigation.


Risk Based Modeling
Ethical, Defensible Science
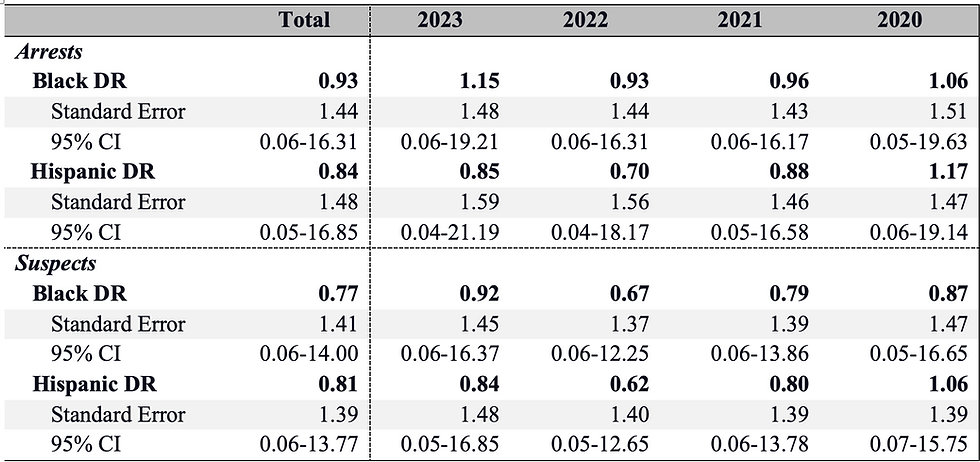
Sentinel partners and consultants have worked on consent decree monitoring teams in majori cities and as racial profiling consultants to USDOJ. We have written many academic papers on the science of racial disparity analysis and are among the nation's leading methodologists in this area. We never benchmark police activities against residential census data but rather utilize risk-based comparators (e.g. crime suspects) to help agencies better explain and contextualize officer activities to external audiences.
Continuous Monitoring.
In-Depth Analysis & Reporting.
Stakeholder Engagement.


Force Factor Distribution
Agencies that partner with Sentinel Strategies Group receive the full depth and breadth of our expertise. In addition to a customized disparity dashboard, we will conduct a review and audit of all relevant data sets, provide recommendations on improved data collection, and annually conduct an in-depth data analysis to identify remaining disparities after considering other relevant contributors, including a variety of situational, officer, suspect, and neighborhood characteristics. Our partner agencies receive an annual report detailing our findings and can rely on us to make presentations and clearly explain our methods and findings to external stakeholders, including city councils, public interest groups, courts, or monitoring teams.